Monitoring gRPC Connection

This is the first post on the series Monitoring GRPC Connection. In this post, I’ll talk about how to monitor gRPC connection based on Nginx.
gRPC is a remote call procedure which is initially developed by Google and later on put into open source community. It is based on HTTP/2. Currently it is being used widely for remote calls, majorly due to Scale & simple service definition. Since gRPC is quite new, the ecosystem is emerging slowly. There are few Load Balancer like NGINX, LINKERD, ENVOY which support gRPC. But monitoring is enabled in not all of them. If you are a server admin or providing some service which is based on gRPC, it’s important to you how the connections are made, how requests are flowing into your server, how many of them are returning 200 status code and how many of them are getting failed??
In this post, I’ll discuss on how to setup Grafana Dashboard on top of your NGINX to monitor the request flowing through it. Nginx provide inbuilt module “stub_status” that exposes all the connection metric of Nginx at Run Time. But the sad part is it works only on HTTP not on HTTP/2. But the good thing is Nginx log has all the useful information you need to monitor the request or you can customize the log to generate so. I’ll use Telegraf to aggregate the data from log and InfluxDB as my database. Grafana will serve the UI.
1. Customizing your Nginx Log
Add this line to customize the log, we are only printing the remote address from which the request is being made to the server. We will aggregate this data to find the number of request made from this Client to server.
log_format custom '$remote_addr';access_log /home/guptaprashant/access.log custom;
2. Setting up InfluxDB
You can simply download InfluxDB from this their official website or follow the instruction for linux machine.
wget https://dl.influxdata.com/influxdb/releases/influxdb-1.6.4_linux_amd64.tar.gztar xvfz influxdb-1.6.4_linux_amd64.tar.gzcd influxdb-1.6.3_1/usr/bin./influxd &
This will start your Influxdb service on 8086 port. You can change the configuration from influxdb.conf file in etc folder. Check your InfluxDB is running or not. Start InfluxDB Shell by
./influxYou will see the message:
“Connected to http://localhost:8086 version 1.6.4 InfluxDB Shell 1.x”
Your InfluxDB setup is done!!!
3. Setting Up Telegraf
You can download Telegraf from their website. Or you can follow this for Linux Machine.
wget https://dl.influxdata.com/telegraf/releases/telegraf-1.8.2_linux_amd64.tar.gztar xf telegraf-1.8.2_linux_amd64.tar.gz
Create a telegraf.conf file with the following configuration.
# Global tags can be specified here in key="value" format.[global_tags]# dc = "us-east-1" # will tag all metrics with dc=us-east-1# rack = "1a"# Configuration for telegraf agent[agent]interval = "1s"round_interval = truemetric_buffer_limit = 5000flush_buffer_when_full = truecollection_jitter = "0s"flush_interval = "1s"flush_jitter = "0s"## Logging configuration:debug = falsequiet = false##CHANGE IT TO COORECT PATH########################logfile = "~/Documents/TIG/telegraf/telegraf.log"#################################################### Override default hostname, if empty use os.Hostname()hostname = ""################################################################################ OUTPUTS ################################################################################ # Configuration for influxdb server to send metrics to[[outputs.influxdb]]urls = ["http://localhost:8086"] # required# # The target database for metrics (telegraf will create it if not exists)database = "telegraf" # required# #precision = "s"# timeout = "5s"# # username = "telegraf"# # password = "metricsmetricsmetricsmetrics"# # Set the user agent for HTTP POSTs (can be useful for log differentiation)# # user_agent = "telegraf"# # Set UDP payload size, defaults to InfluxDB UDP Client default (512 bytes)# # udp_payload = 512################################################################################ INPUTS ###############################################################################[[inputs.logparser]]####GIVE THE CORRECT PATH OF NGINX LOG FILE.files = ["/home/guptaprashant/access.log"]from_beginning = true## Method used to watch for file updates. Can be either "inotify" or "poll".watch_method = "poll"[inputs.logparser.grok] patterns = ["%{IP:client1}"] timezone = "Local"
Save this file & start the telegraf. Set $PATH=PathOfTelegraf . And save the telegraf.conf in path : $PATH/etc/telegraf.
cd $PATH/etc/telegraf./telegraf --config ./telegraf.conf
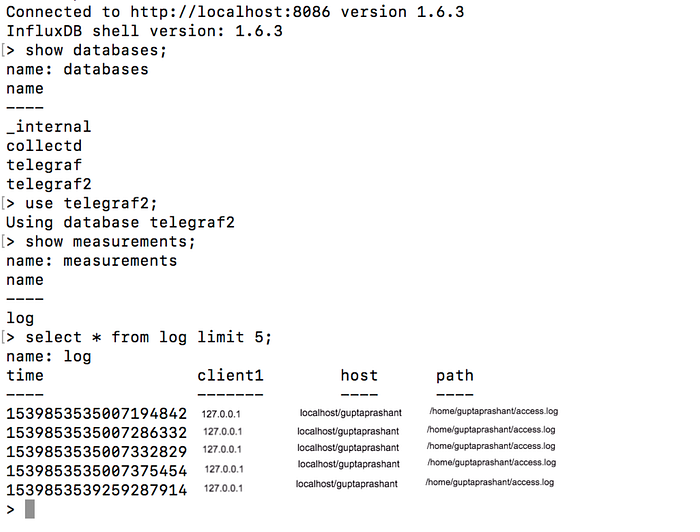
That’s it. Telegraf will start pumping the data into InfluxDB. You can verify it in you database.
cd influxdb-1.6.3_1/usr/binStart the InfluxDB Shell../influx> show databses;> use telegraf;> show measurements;>select * from log limit 5;
Now its only left to make a Dashboard, which plot your data nicely.
4. Setting Up Grafana.
Grafana is a nice open source & widely used UI tool. Its easy to setup and use it. You can directly download from its official website. You can follow below for Linux machine.
wget https://s3-us-west-2.amazonaws.com/grafana-releases/release/grafana-5.3.1.linux-amd64.tar.gztar -zxvf grafana-5.3.1.linux-amd64.tar.gz
Start the Grafana server:
cd Grafana-5.3.1/bin./Grafana-server
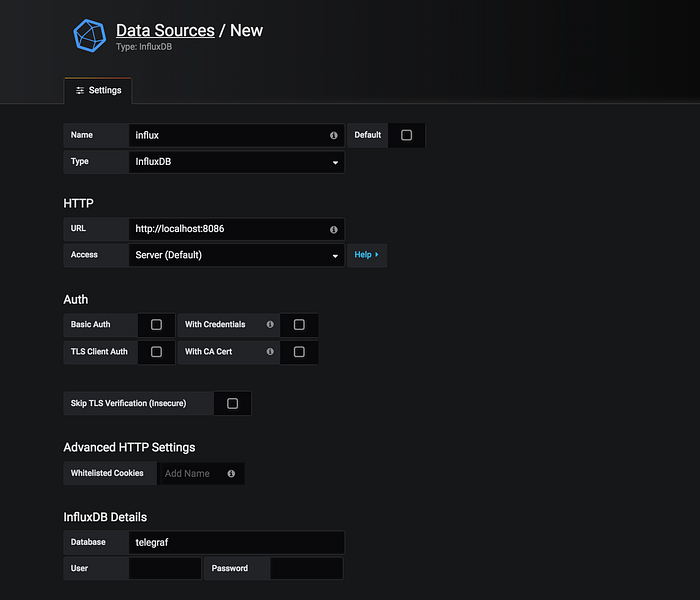
Grafana Server will get start on http://localhost:3000. Login with user & password as admin. Go to Configuration. Add a DataSource with Configuration show below.
Go to Create Dashboard. Create aDashboard and add as DataSource as done below.

You will be able to see a plot as shown above. You can see data almost live here by latency of less than 2 secs.
Conclusion:
Nginx is a very popular Load Balancer and since it started support for gRPC it is being widely used for gRPC too. But the community version of NGINX doesn’t provide the tool to monitor request & other metrics. This post is targeted for those engineers who want to monitor the request. In the next post, I will write about how to expose other metrics of Nginx to a nice & visual dashboard. Hope it is helpful to you.
Please comment your feedback. Thanks!!!
